Engineering Capacity Management
Background
You work for Legion Digital, a fortune 500 that recently catapulted into the top 100 companies in the world with innovative lending products primarily designed, to help grow technology companies globally. Legion Digital has diversified its product by developing a high-end mobile device called “The Roman”. The Roman is tied to the members Legion Digital bank account, Legion Digital credit card, corporate card and any lines of credit associated.
You have two roles in this value stream, you are both the Portfolio Architect and the Principal Engineer. The Roman has experienced a monumental amount of success, at the end of its first full year in the market it has taken 30% of the market share for mobile devices. The Roman is not sold, it is given to companies and their employees that use Legion Digitals financial products, and members receive great incentives and financial benefits for using it.
However, with great success, comes great struggle. The Roman’s rapid growth is starting to have the following challenges.
Problem Statement
Delivery Cycle-time: New features and capabilities are now being released 3 slower than the previous year. These late releases are impacting business. Some of the releases are only relevant at certain times, some of them are contractual and parts of partnership agreements and some are regulatory.
Cost of Engineering: The overall cost to continuously improve the Roman has continued to grow in all directions: engineering, infrastructure, administrative and business. This cost is beginning to impact the overall profitability of the Roman.
Scope & Direction: The communication and transparency between and Engineering and Product is becoming opaque, resulting in Engineering delivering products that don’t provide business value and, in some cases, harming the members perceived value of the Roman.
Objectives (OKRs)
Objective 1
Accurately manage and assess overall resourcing and engineering effort towards product delivery.
Objective 2
Accurately manage and forecast overall product delivery and constraints.
Objective 3
Accurately manage and monitor process and operational issues as effectively as possible.
General Information
(understanding the Engineering Problem)
- Teams operate as Scrum Teams, ideally of 6 to 9 people, sometimes they are smaller or larger, but that is not ideal
- Some teams break standard operation protocol, there is has not been a uniform solution to fix this
- Some teams don’t update their workflow appropriately or in a timely manner
- Some people are dedicated to 1 team some are on multiple
Teams have different:
- Velocities
- Skill set mixes
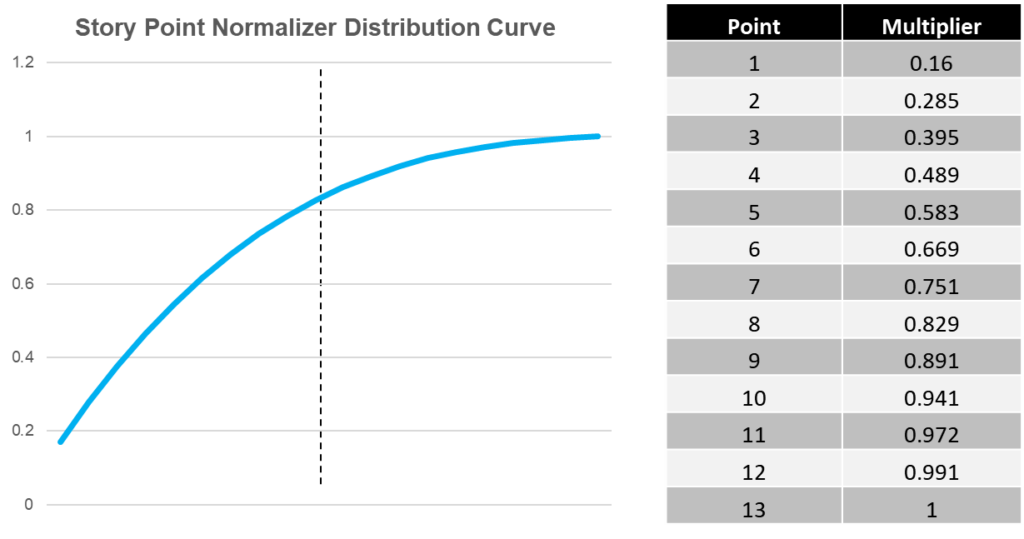
- Value to Fibonacci
- Sizes
- Operating hours
- Location mix (co-location)
- Tenure in life-cycle (newer/older)
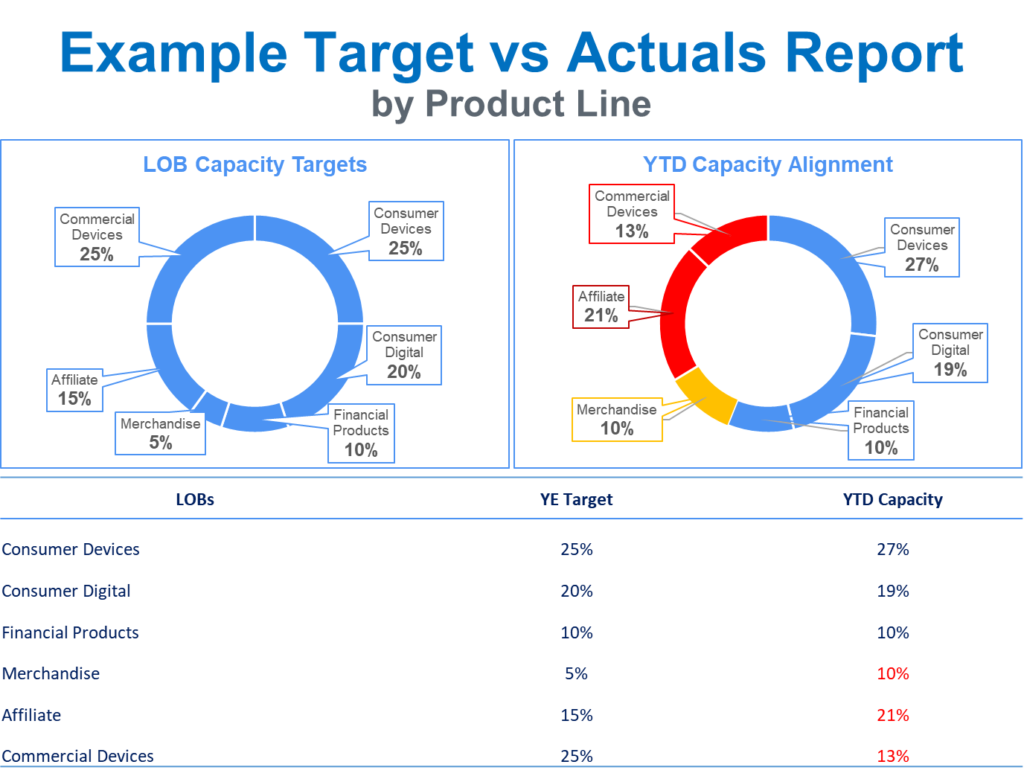
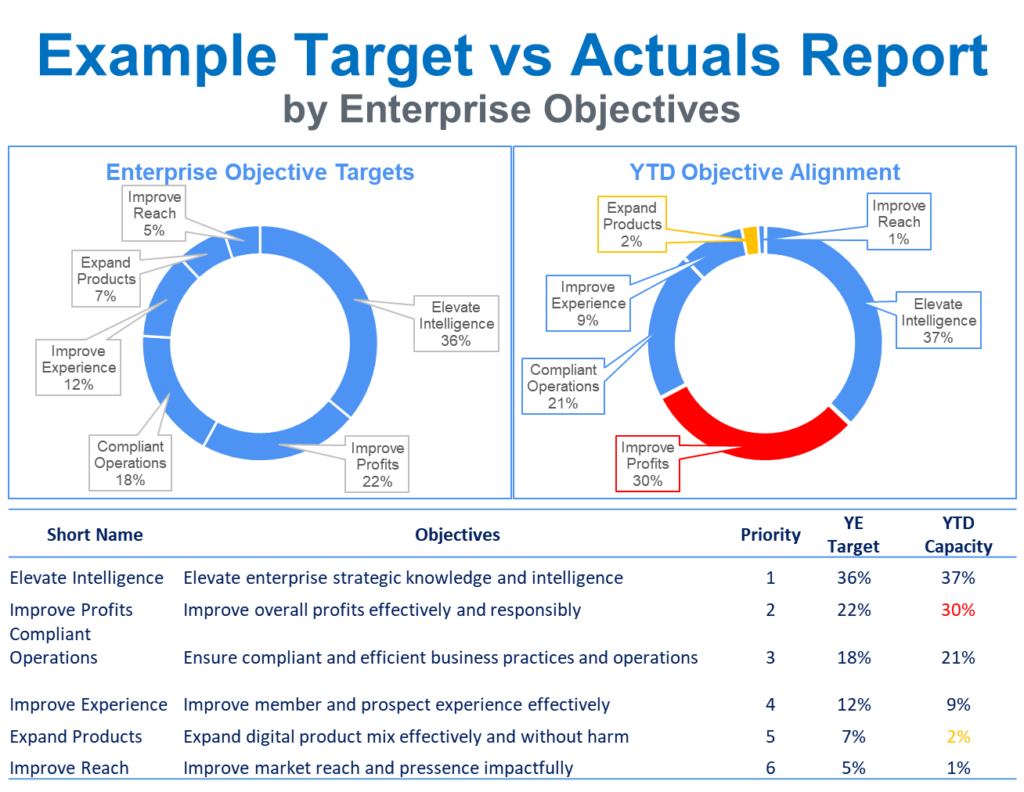
You’ll use the provided data sets and create derivations and enrichments in excel to generate three final reports/dashboards that should be similar to the three samples below. There is an option for a fourth report to assess data quality for advanced users. Also there are two options as a starting point:
Junior Engineer Lvl: All of the more complex data enrichments have been created, including the pivotal Engineering Capacity Data Product and it’s supportive derivations. You will need to use the data that has been generated in this file to create a few more derivations for the purpose of creating a meaningful visual and develop the dashboards shown below.
Dark Data Engineer Lvl: You have only the original data sets and reference table, you’ll need to use all of your contextual information, computational & logical thinking and dive deep into the Dark Data to create the derivations needed to develop the pivotal Engineering Capacity Data Product.
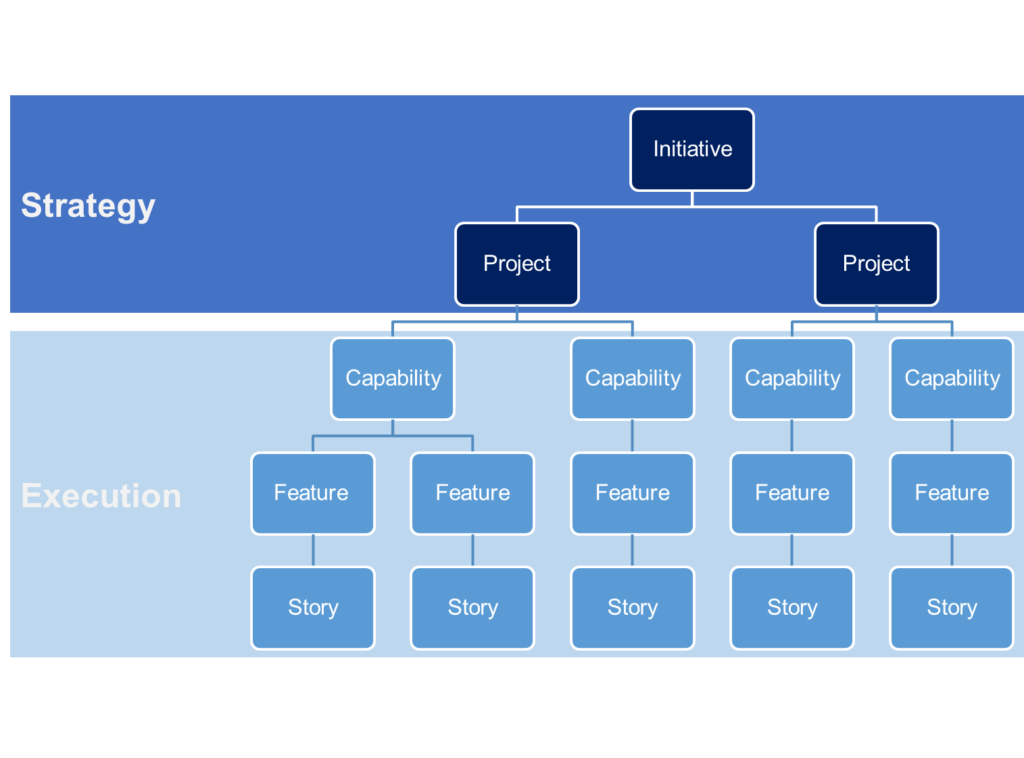
The first report is capacity by product line. It has the targets by LOB next to the YTD actuals, along with call outs that allow users to quickly identify what results are misaligned.
The second report is capacity by enterprise objectives. It has the targets by objective next to the YTD actuals, along with call outs that allow users to quickly identify what results are misaligned.
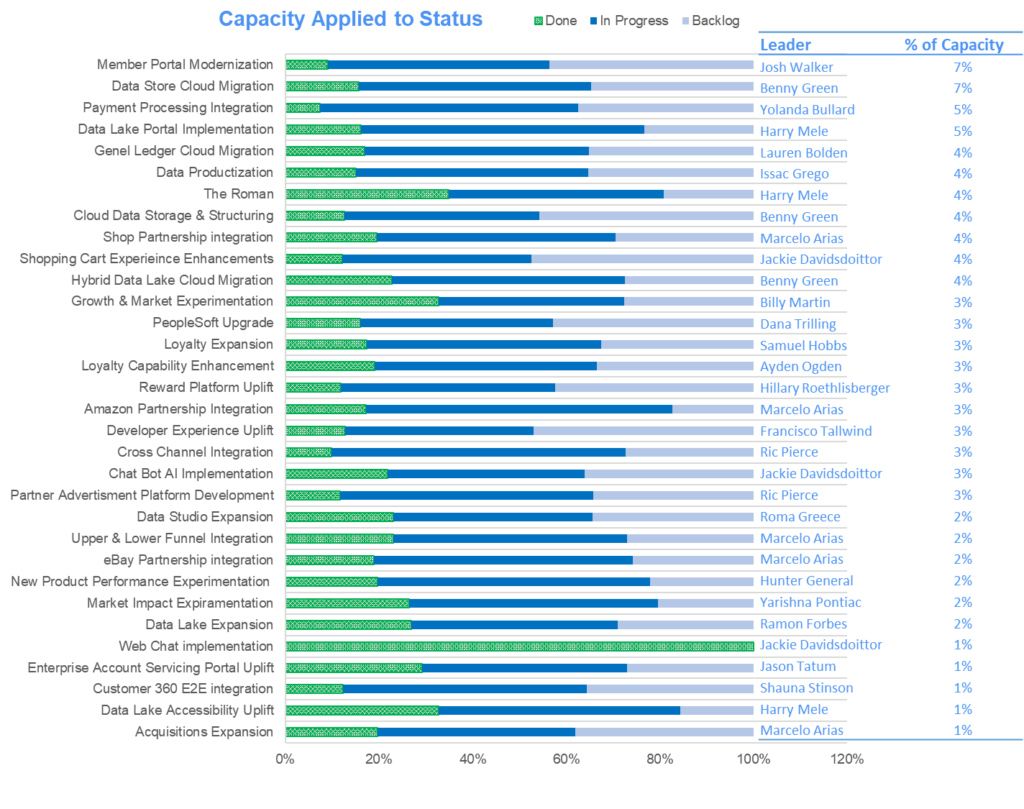
The third report is capacity by project status. It has capacity aligned to each ongoing project and further separated into the status that the features and smaller tasks are in within each project. This allows the user to quickly identify which Projects have a specific amount of capacity. Giving decision-makers the ability adjust the aligned work or capacity as needed to achieve the correct sequencing and resource alignment needed to deliver value to the customer.
Data Quality Report (Advanced)
- You will also need a data quality report that provides the management team with visibility into the data and inner-workings of each team and see if their operations are healthy, this report should clearly allow the user to drilldown into exactly who they need to contact if things are out of line.
- This data quality report should have tolerances that only deems something healthy if it is under 3% error.
Warning: The Red Tabs are for reference, DO NOT CHANGE THE VALUES IN THE RED TABS.
This is the Formula that we’ll be using to develop our capacity data product, We’ll use an array of Dark Data as contributing factors for this formula.

General Instructions
- Green tabs are guides. You’ll need to use the directions and the data from the various tabs to get the information completed in each tab.
- After you’ve gotten the green tabs completed, you’ll need to use the data in various tabs to develop a UI for two reports: Product Deployment & Data Quality
Product Deployment Report
- You will need to use the data in this spreadsheet to develop an Engineering Capacity Report that allows leaders to quickly understand if their capacity targets are on target or if they are not.
- The report should also allow leaders to quickly understand if the initiatives that they need delivered have the right amount of capacity or not.
- The report should also allow leaders to quickly understand if the initiative that they have targeted for delivery are on track.
Data Quality Rules
- Scrum teams should be no less than 5 people and no more than 10 (exceptions can be made for two teams that work as one team)
- No User Story should have points exceeding 13, any number higher should be treated as 13 (ex: story point of 24, should be treated as 13, and the own should receive a notification advising them of the error)
- Sprints are two weeks, duration is measured in sprints.
- Feature releases are bi-monthly and generally comprise 4 sprints (in some cases it may be 5 sprints depending on the length of the month)
- Generally features should take more than 3 sprints to complete, but they should usually be two sprints.
- Also stories need to be completed with all data except for stories in the backlog that aren’t scheduled for the next two sprints, some stories many not have any schedule related data if they are in the backlog
- The hierarchy of work related artifacts is as follows (starting at the lowest level): Story >> Feature >> Capability >> Project >> Initiative
- OKR’s are mapped at the capability level to help provide a mix of top-down and bottom-up insight that allows people to see how their work applies to the organizational directive.

